


Waves at sea


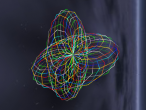
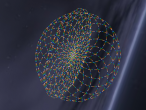
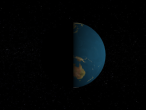
Following my previous blog about 3D function graphing, I did another experiment to animate the 3D graphs. In this blog, I used the same 3D function f(x,z) = x*z^3-z*x^3 to generate two sets of heights. Then a VECTORINTERPOLATOR (or VECINT) was used to animate this 3D graph. It looks to me like a wave on the sea surface. What do you think?
Here is the animated 3D graph for you to have a play. You can press m key in the 3D scene to switch the rendering from point to line to face. I also applied an image texture to make it look more like water. Another SCALARINTERPOLATOR (or SCLRINT) was used to rotate the image texture so, it looks like the water is running, hopefully.
Below is the Logo program I wrote for this animating 3D graphs.
The idea of this animation is to collect two sets of heights (y1 and y2) then apply to the ElevationGrid. The y1 and y2 lists, as can be seen in line 15 and 16, are inverse of each other (exchanging x and z). The VECINT then took three sets of keyValues as y1 and y2 and then back to y1 to complete the animation cycle, done by the TIMESENSOR and 2 ROUTE commands. The SCLRINT in line 38 generate a scalar value_changed and routed to the TextureTransform node.
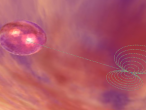
What do you think? Does it look like the waves on the sea?
The 3D functions can be used to simulate many natural phenomena. Use the idea in this blog, I may be able to create some sea weeds waving under the sea.... If you have any ideas about using 3D functions to create objects, please share below in the comment area. ![]()
Files: Sea_surface.x3d Sea_surface.logo
- Andy's blog
- Login or register to post comments
- 12043 reads