


3D Graphing


There are many 3D visualisation software for mathematics. Most of them allow easy input of a function to create a 3D graph. VRMath2 also allows creation of 3D graphs. It may not be so easy if compared to other software. But I think that VRMath2 is better for learning because it provides more opportunities for construction throught programing. I call this the power of "Programming driven 3D modelling and visualisation".
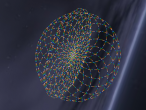
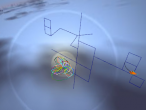
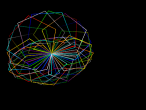
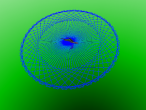
I just had a quick idea to demonstrate about graphing or ploting in 3D space. I found a couple of interesting functions online, and thought I would like to try this function: z = x * y^3 - y * x^3. Just in few minutes, my experiment was quite successful.
And here are the Logo program for this 3D plot.
In the above program, you can change the mathematical function in the fn procedure to get a different plot. I hope in the future, community members will build up library of 3D artifacts including 3D virtual worlds and Logo programs so we can reuse them for other virtual worlds and applications.
Please leave me a comment below and let me know what you think. 
Files: 3D_plot.x3d 3D_plot.logo
- Andy's blog
- Login or register to post comments
- 8023 reads